Technology teams measure scaled software delivery using a plethora of technical metrics, including story points delivered, commits per project, and build success rate. While these proxy metrics help monitor the performance of a specific activity, they measure the process rather than the outcome. Instead, Flow Metrics measure the rate of business value delivery for software products through the lens of your customers, whether internal or external.
Flow Metrics: A Business Leader’s Guide to Measuring What Matters in Software Delivery
View the eBook • Flow Metrics: A Business Leader’s Guide to Measuring What Matters in Software Delivery
Measuring Flow Metrics allows technology teams to continually optimize their processes in real time and deliver greater value to their organizations. Flow Metrics provide a common language between business and IT, allowing for collaborative decisions to be made around software delivery that align with business goals. These business-centric metrics are part of the Flow Framework® — a structured, prescriptive approach to Value Stream Management.
In this article, we’ll introduce you to what Flow Metrics are, how they are measured, and why they play such an essential role in optimizing software delivery using the Value Stream Management approach.
What are Flow Metrics?
Flow Metrics center around the principle that all software-related work – design, development, and delivery – must create value for the business. And if not, then serious consideration should be given to why the work is being done. These five metrics present a new approach to measuring software delivery value streams against business outcomes:
- Flow Velocity®: Is value delivery accelerating?
- Flow Efficiency®: Is upstream work holding up delivery?
- Flow Time: Is time-to-market getting shorter?
- Flow Load®: Is demand vs. capacity being balanced?
- Flow Distribution®: Are we investing in both business value generation and protection?
The Flow Metrics categorize value-creating work into four types of Flow Items, including Features (relating to business value), Defects (representing quality), Risk (security and compliance), and Debt (obstacles to future delivery).
By capturing objective data about these types of work from across integrated software delivery toolchains, organizations can generate clear business-centric metrics that will improve cross-organizational decision-making to help answer important questions such as:
- How is software delivery impacting revenue, quality, and costs?
- What’s slowing down value delivery?
- How are DevOps, Agile, and SAFe® transformations performing?
- Where should strategic investments be made to improve business outcomes?
These questions can be answered by analyzing Flow Metrics and key business outcomes such as value to the business, cost of operation, product quality, and employee or team engagement.
Recommended Read: Flow Metrics: A Business Leader’s Guide to Measuring What Matters in Software Delivery
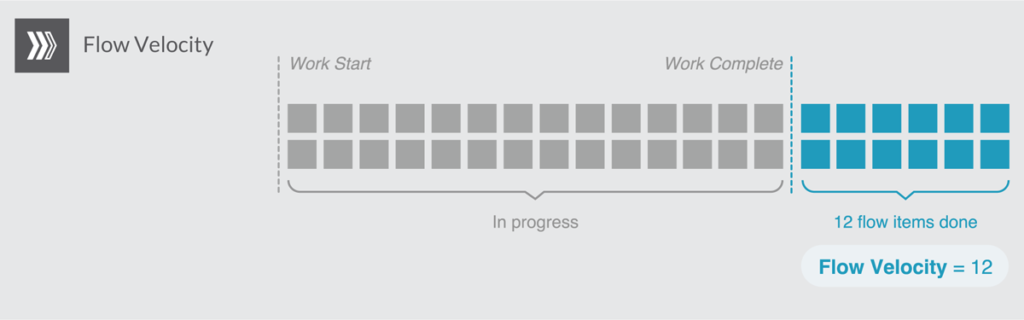
Flow Velocity®: How fast is business value being delivered?
Flow Velocity answers the question, “Is value delivery accelerating?”. It measures how many Flow Items are being completed—or the throughput—during a given period. It is a measure of productivity and, along with Flow Time, is known as a “money metric”.
Teams immediately understand how many Flow Items are completed versus how many are in progress. Additionally, by tracking Flow Velocity over an extended period, teams gain access to historical data that can be used to see if their delivery rates have improved. This can help provide more accurate forecasts on how much work (and value) they can deliver.
This metric does not rely on estimating the size or scope of work (as story points do) or the priority of each Flow Item. It assumes that scope and priority have already been defined and therefore focuses solely on the end-to-end movement of the Flow Items.
Focusing on end-to-end flow is important for software delivery since the scales of economy that exist in traditional manufacturing do not apply. Complexities such as late feedback, code versions, quality test results, bug tracking, and status reports mean that large batch sizes increase the cost of deploying the software. These large batch sizes and slow delivery cycles also increase the cost of delay since value only gets realized once the software is in production, supporting the user and obtaining feedback for improvement.
For example, a company may want to focus on major software updates that take a long time to complete. This low Flow Velocity can, in turn, hurt renewal rates among its customers who need more value from the solution.
Conversely, minor updates released faster and incrementally can drive higher renewal rates since customers frequently derive more value from the improved software. In this case, Flow Velocity doesn’t just increase renewal rates; overall employee happiness improves due to delivering more value faster.
It is important to track Flow Velocity in a way that is easy for the human eye to consume. For example, all stakeholders can easily understand data when it is visualized in a way that shows the viewer how many items are delivered in a month.
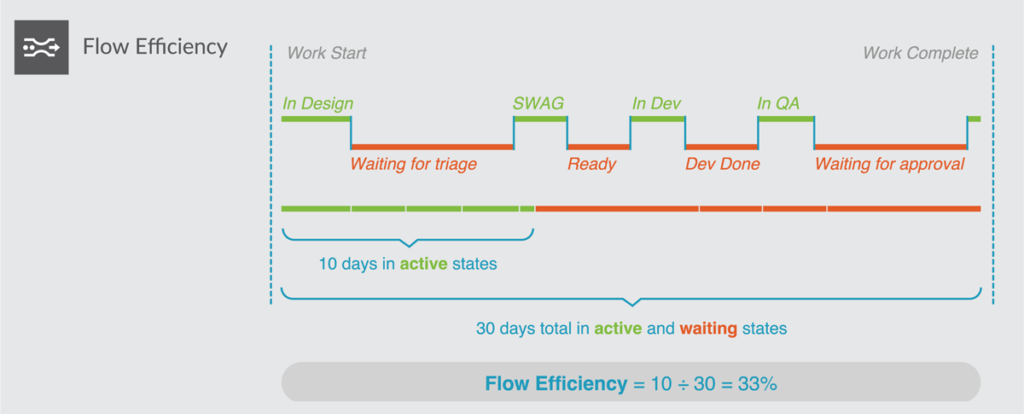
Flow Efficiency®: What value-adding work are teams undertaking?
Flow Efficiency helps determine the proportion of Flow Items actively being worked on. It is used to identify where waste and wait states are holding up value delivery (or Flow Time). If Flow Efficiency is low, waste exists in the software delivery process since items stagnate in a wait state for some reason.
This stagnation causes a domino effect. The more items in a wait state, the more work in progress (WIP) or Flow Load, and the more bottlenecks in the value stream. As bottlenecks grow, waste increases, adding further delay. With the Flow Efficiency metric, you can readily see excessive wait times and work to reduce or eliminate bottlenecks.
It is important to note that this metric is based on Flow Time (the time it takes for work to be completed from the moment it enters the value stream) as opposed to cycle time (which is often used in DevOps and measures the time it takes to complete a single step). Therefore, it captures the upstream and downstream wait time, monitoring the whole value stream and process from end to end.
An example of Flow Efficiency in action
One large US healthcare organization was able to use Flow Efficiency to improve its processes. Despite their high Flow Velocity, team happiness was low, with many members complaining about too much context-switching.
Curiously, their Flow Efficiency was high, showing that there were almost no wait states. By digging deeper, they found a very high number of active states occupying workers’ time. This information caused them to change the way they tagged their work, resulting in the identification of more wait states and a much more nuanced and accurate understanding of their true Flow Efficiency.
This process improvement was only possible with the insight provided by the Flow Efficiency metric.
Flow Time: How fast are we delivering business value?
Every second counts in software delivery. That’s why Flow Time – the other “money metric” along with Flow Velocity – is so important to IT and business leaders. This metric tells you what your time to value is, thereby providing a measure of speed and predictability. Crucially, this metric enables more accurate time-to-market forecasts, improving customer relations and supporting more accurate financial planning for the business.
Flow Time helps to clear some of the ambiguity around time measurement in software delivery. For example, in manufacturing, there are two metrics used for process improvement; lead time and cycle time.
Lead time in a manufacturing context measures the entire process from when a customer makes the request to completion. Cycle time refers to the time it takes to complete a step in the process. When it comes to software delivery, these terms could be clearer. DevOps use lead time to refer to the time between code commit to code deploy, which is very developer-centric and represents only a small part of the value stream.
Using Flow Time eliminates this confusion by using a customer-centric measure of time. It is the elapsed time work takes to complete from the moment it enters the value stream to the moment it is completed and in the hands of the customer. It includes both active and wait states, as well as both weekends and off-hours.
This metric can determine if investments are accelerating time-to-value by analyzing trends over time. Flow Time appeals to business and product owners as it can tell them how long a request takes to complete once it has been approved.

Flow Load®: Is demand outweighing capacity?
Flow Load measures the number of Flow Items being actively worked on in a value stream, essentially quantifying WIP. If the total number of items being worked on (in either an active or waiting state) is too big, there will be a negative effect on output.
This metric plays an important role in the happiness and engagement of the people who plan, build, and deliver software and directly correlates to productivity and quality of work. With the rise of burnout among IT staff, there’s an increased focus on ensuring teams are not being overburdened as demand grows to shift to a digital business. In this regard, Flow Load can be a key metric in predicting and improving overall employee morale.
Monitoring Flow Load shows changes in Flow Velocity and Flow Time, allowing the business to see the point at which taking on too many Flow Items simultaneously reduces output.
Conveniently, this visibility allows teams to set a level that maximizes Flow Velocity and minimizes Flow Time, such as increasing the workload for more experienced teams working on a mature product value stream and reducing it for a smaller team working on a new product.

Flow Distribution®: Do we have a healthy and dynamic mix of work?
To maintain Flow Velocity and accelerate the delivery of business value, all product value streams should be working on a mix of Flow Items that reflects the maturity of their product and lines up with their organization’s desired outcomes. There are four types of Flow Items: Features (relating to business value), Defects (representing quality), Risk (security and compliance), and Debt (obstacles to future delivery).
Flow Distribution measures the quantity of each type of Flow Item in a value stream to ensure investment is balanced between business value generation and protection. By tracking the proportion of Flow Items within the value stream, businesses have the data-driven analysis they need for important discussions around trade-offs.
An organization’s ability to identify trade-offs is one of its greatest attributes. For example, high Flow Velocity may be required to get a new product to market quickly. This type of focus may make perfect sense when speed to market is the desired strategic outcome, for example, to capitalize on a market condition or beat a competitor.
However, focusing on speed often comes at the expense of working on other items, like bugs (or Defects) and technical debt. If left unaddressed, this imbalance could undermine the stability of the product moving forward. Flow Distribution makes all types of work visible and ensures teams can understand the impact of their decisions to prioritize one type of Flow Item over another.

How Can Value Stream Management Help Software Delivery?
Global enterprises require a better way of measuring the business impact of their IT investments. By adopting a value stream management approach, the Flow Framework bridges the gap between business strategy and technology delivery, moving away from managing IT as a siloed set of projects and cost centers.
This approach sets up an organization-wide feedback loop, allowing access to powerful Flow Metrics for continuous data-driven improvement that tells you if you are moving in the right direction.
With a steady focus on business results instead of activities, the framework helps improve investment tracking, customer relationship building, and employee engagement, all while reducing time to value.
Presenting Flow Metrics in a visually digestible way is equally important as identifying them. Planview Tasktop Viz® provides instant access to an organization’s value stream metrics in a simple, customizable interface and with all the tools for creative data presentation.
